I asked ChatGPT to plot the ratings distribution. It gave me this chart.
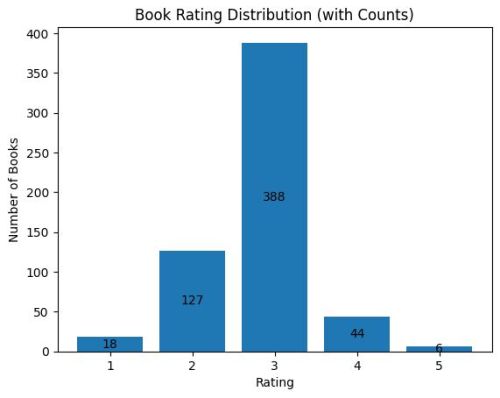
At first blush, this seemed like a normal distribution aka bell curve. But ChatGPT disagreed.
No – a normal (bell-curve) distribution would be:
roughly symmetric around the mean, and
have similar frequencies on both sides.
Your distribution is:
strongly peaked at 3 stars
skewed, with sharp drops toward both ends
So it is not normal.
I then asked ChatGPT if it my ratings follow a power law distribution.
It first plotted the following log-log chart:
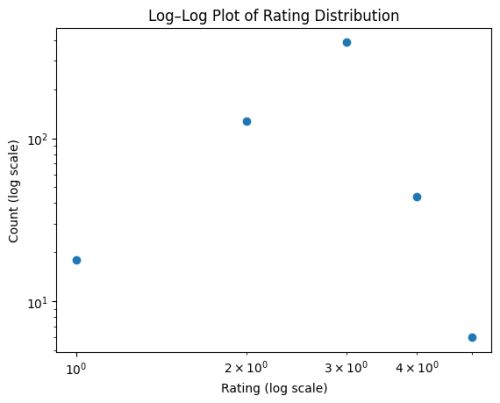
And then said no.
Also no. A power-law distribution would:
- show a straight-ish line on the log–log plot
But your log–log chart bends sharply — the middle category (3?) dominates instead of a smooth decay. That means it does not follow a power-law either.
It felt “this looks like a truncated / central-bias distribution whereby readers mostly rate books as “okay” or “average” and give far fewer “very bad” or “very good” extreme ratings”. Apparently, this pattern is common in subjective rating systems where people avoid extremes. This was news to me. I don’t recall this distribution from my Quant Marketing course in MBA or subsequently in my working career.
Action: Learn about truncated / central-bias distribution.
ChatGPT then offered to run a goodness-of-fit test (e.g., normality test), or compare this with Amazon / Goodreads typical rating curves to interpret behavior further. Neither Amazon nor Goodreads existed when I got my MBA degree, so I’m sure I hadn’t studied these tests and curves. Anybody who plans on acting on this insight would need to get a good handle on them, which brings us to the next action.
Action: Learn goodness-of-fit test and comparison with Amazon / Goodreads rating curves.
Coincidentally, as I was writing this post, I was tipped off to a 10-point rating scale used by a leading auto manufacturer in which 1 to 8 is poor, 9 is average and 10 is excellent.
Which “genius” in Indian car industry invented the absurd scale for post-service survey: What is your rating on a scale of 1 to 10, where 1 to 8 is poor, 9 is average, and 10 is excellent?!?
Would love views of mktg experts such as @GTM360 and @beastoftraal
— R_Ganesh (@r_ganesh) December 26, 2025
At first blush, this scale does seem absurd. However, I now wonder if it’s the result of some modern market research technique meant to eliminate the aforementioned truncated / central-bias distribution problem.
This also reminds me how I felt weird when I first heard that a 5* rating on Uber did not signify superlative experience but merely that nothing went wrong during the trip.