Soon after the demonetization of high value currency notes in India in 2016, there was a huge cash crunch and the public was exhorted to switch to cashless methods of payments like mobile wallet, NEFT, and cheque (UPI boom happened a little later). Many Indians were skeptical of the offtake of digital payments due to poor infrastructure and low literacy levels in the country.
I took a contrarian stand: Citing previous instances when India had succeeded by putting the cart before the horse, I boldly predicted that, with no changes to infrastructure or literacy, India would touch 50% cashless penetration. See #CashlessIndia – Why Putting Cart Before Horse Will Work for more.
I based my optimistic outlook on the back of my observation that tons of literate people with adequate infrastructure had eschewed cashless payments in the past. I figured that it was possible to drive nontrivial adoption of digital payments by simply getting those people to overcome their inertia and switch from cash to cashless modes without any improvements in infrastructure or literacy i.e. plucking the low hanging fruits.
Let’s see how my eight year old prediction has fared.
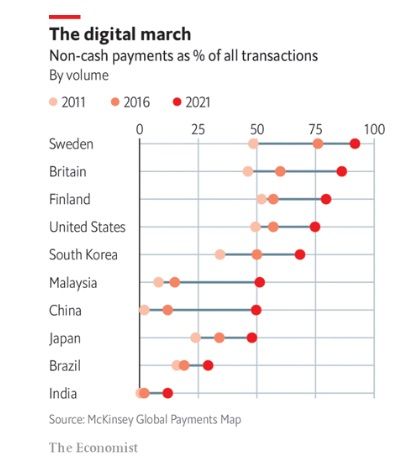
- According to the following exhibit from McKinsey via The Economist, cashless payments as a percentage of all transactions in India rose from around 2% in 2016 to around 15% in 2021.
- In a recent article entitled How The Clearing House is using billers to boost real-time payments, American Banker quotes Statista as saying “half of all transactions in India happen via real time payments i.e. IMPS / UPI”. (Ever since Statista conflated payments volume and total payments value (TPV) here, I’m a little skeptical of its data – I’m putting this stat out here only because it appeared in a reputed publication like American Banker).
It’s clear that my prediction has aged well, even if I say so myself!
The rate of adoption of any technology is driven by how much delta it drives between the customer’s TO-BE and AS-IS situations. For the uninitiated, AS-IS is the status quo before a technology is adopted, and TO-BE is the status after the technology is adopted. Put colloquially, technology adoption is shaped by “Is the juice worth the squeeze?”
In my 40 years of selling technology, one consumer behavior trait has remained unchanged: Doomerism. This is how some people assess any new technology from the baseline of Utopia and hastily dismiss it as unworkable. In other words, these Debbie Downer type people will glorify the AS-IS situation beyond the current reality, which automatically shrinks the delta between as-is and to-be situations. I call them “Doomer” and their mindset Technology Adoption Prediction Utopia.
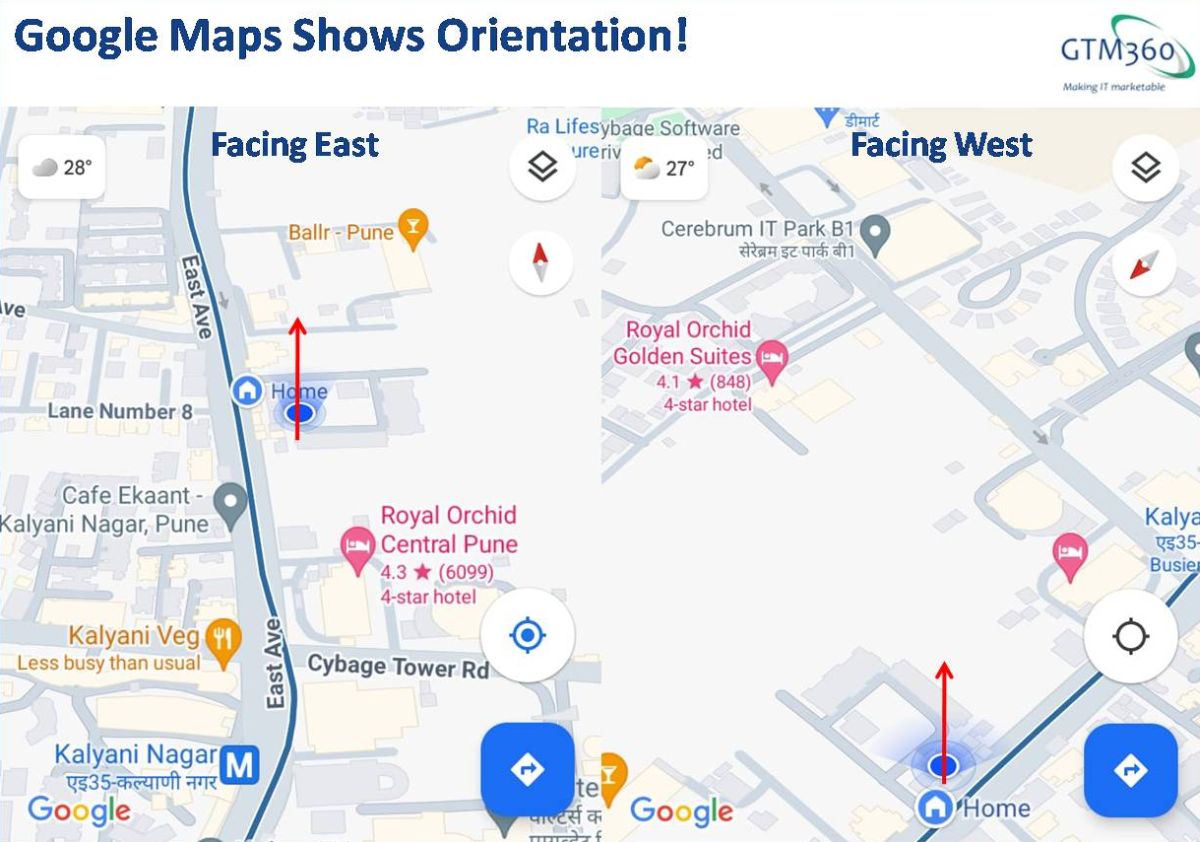
Let me give an example of TAPU mindset: A Doomer predicted that LBS (Location Based Services) technology will flop because smartphones can’t display the orientation of users on Google Maps.
How wrong this Debbie Downer proved to be:
- Despite not knowing the user’s orientation on Google Maps, the AirBnBs, DoorDashes, Olas, Ubers, and Zeptos of the world have created hundreds of billions of dollars in value for their stakeholders.
- I cheated a bit above. Smartphones equipped with acceleromater and gyroscope do display orientation on Google Maps. See following illustration as Exhibit A. But they’re restricted to high-end handsets whereas the LBS apps listed above work even on low-end and midrange models that can’t show orientation.
I’ve started seeing TAPU behavior in AI now.
While judging the performance of AI Chatbots and predicting their adoption in Customer Service, Doomers elevate call center CSRs to Newton / Einstein level of IQ. Comparing the intelligence of AI Chatbots with that unrealistic level, they dismiss AI Chatbots as useless. They totally miss that most CSRs in banks, telcos and other companies are morons with room temperature IQ who could have been replaced even by the dumb chatbots of the past, as I highlighted years before the launch of ChatGPT in my blog post titled Can Chatbots Replace Humans?.
TAPU leads to wrong predictions about the future of technology. Therefore, it should be avoided.
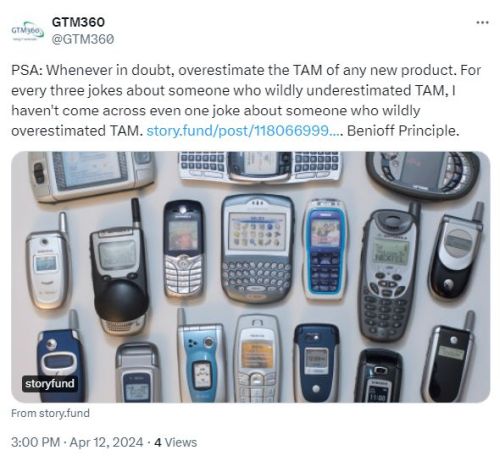
If Technology Adoption Prediction Utopia should be eschewed, what model should we use to predict the adoption of technology?
Enter Technology Adoption Life Cycle (TALC).
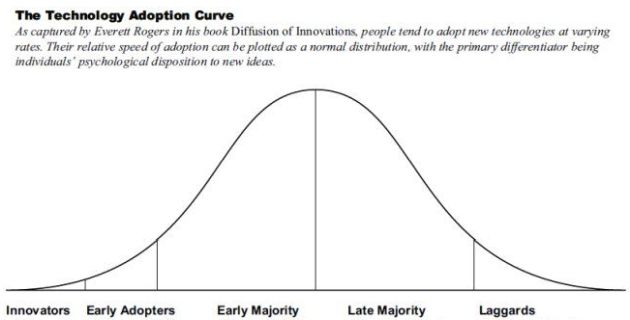
According to TALC, adoption of any technology goes through five phases:
- Innovators (1.5%)
- Early Adopters (13.5%)
- Early Majority (35%)
- Late Majority (35%)
- Laggards (15%)
The early two stages are called Early Market, which accounts for 15% of the total market.
The later three stages are called Mainstream Market, which accounts for 85% of the total market.
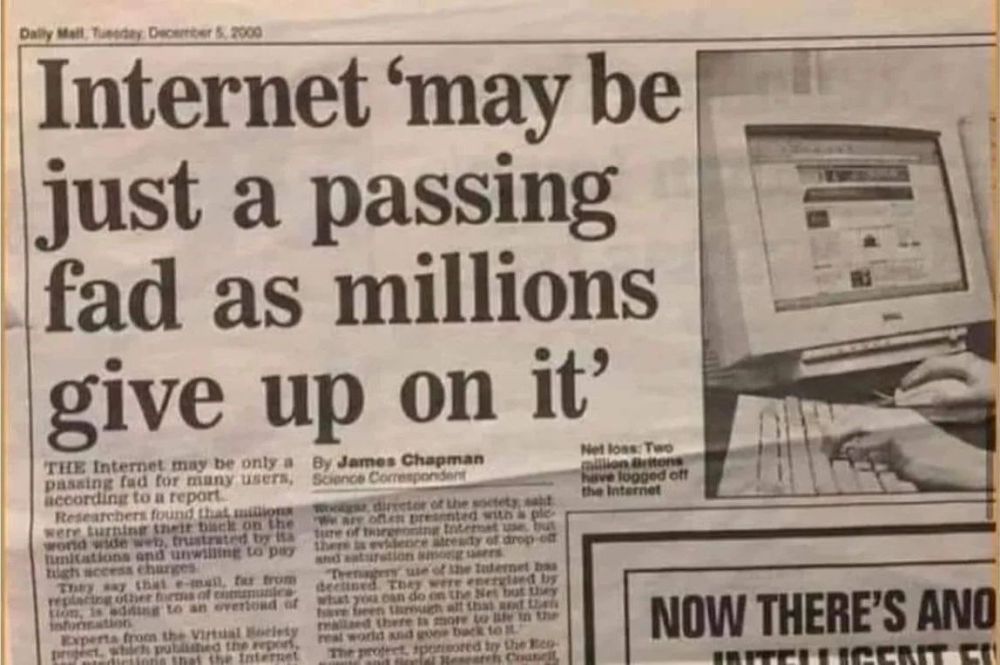 There’s a chasm between the two markets. While it takes 10X effort to cross the chasm to go from the early market to the mainstream market, any new technology can gain a foothold in the early market by marginally improving the status quo.
Lest anyone think that’s not good enough, take EV. Although the technology has less than 5% penetration of the Total Addressable Market of automobiles, Tesla, the forerunner of this technology, has created hundreds of billions of wealth for its promoters, investors, customers, employees and suppliers.
So could AI.
That’s because doers make progress believing that “no one bats a thousand” whereas Doomers are idealistic and thwart progress.
