I concluded my blog post entitled Demystifying The Ubiquitous Sample Size Of 2000 on the following note:
A survey with a sample size of merely 2000 can deliver statistically significant results for a population of millions provided the sample is representative of the population, which is determined by how homogeneous or heterogeneous the population is.
Key Questions on Statistical Significance: (1) How statistically significant is an opinion poll of 300M population conducted via sample of 2000 people? (2) How to prove that sample is representative of population? (3) How to quantify extent to which population is homogeneous?
— Ketharaman Swaminathan (@s_ketharaman) October 7, 2020
In this post, we will explore ways to assess a population’s “composition” i.e. how homogeneous or heterogeneous it is. That, as we saw earlier, determines the validity of the very notion of statistical significance.
Any assessment of a population’s composition begins with the topic of attribute. Attribute is the aspect that we’re trying to judge a population’s composition on. Examples of attributes include nationality, income, age, lifestyle, and so on.
We can make this assessment qualitatively in the case of some attributes e.g. nationality, income.
- Almost all of the 1.3 billion people in India are Indians. Therefore, the population of India is highly homogeneous on nationality.
- Per anecdata, there’s rampant inequality in income in USA. Therefore, the population of USA is heterogeneous on income.
But for some other attributes, it’s not easy to make a qualitative assessment of composition.
Take lifestyle for example. In his comment on Finextra, Melvin Haskins of Haston International Limited observes:
Whilst the USA has a population of 330 million in 50 states, there is no comparison between the people of New York and of Wyoming. They may be in the same country but their (values, habits and) lifestyles will be very different. Any survey of 2,000 in the USA has no chance of reflecting the diversity in the country.
True dat. Not just diversity but also brand preference. Since there are thousands of product categories and tens of thousands of brands, it’s impossible to make a qualitative assessment of the composition of any reasonably large population on brand preference.
Ergo, we need a quantitative measure.
I asked a few data scientists whether there was any way to (1) rigorously prove that a sample is representative of the population, and (2) quantify the population’s composition in terms of how homogeneous or heterogeneous it is.
I didn’t get any replies.
Intrigued by the silence, I looked up my 30 year old MBA text book on quant methods. It says this subject lies at the heart of the objectivist-subjectivist controversy and no definitive answer can be given on it.
I didn’t bother to go back to my 35 year old philosophy (Humanities elective during Engineering, if you want to know!) text book to figure out what the objectivist-subjectivist controversy was all about!
One follower on Twitter pointed me to an old Scientific American article entitled How can a poll of only 1,004 Americans represent 260 million people with only a 3 percent margin of error?. The author explains the “how” part well but caveats his methodology with the condition that “survey respondents must be sampled at random from the population”, and admits that “it’s not easy to fulfill that condition in any real world survey”.
Hello, duh, thank you Captain Obvious!
I was back to square one.
Then my classmate from IIT Bombay pointed me to Standard Deviation.
Bingo!
As we know from Statistics 101, homogeneous means low standard deviation (close to 0.0) and heterogeneous means high standard deviation (close to 1.0).
Problem solved?
I’m afraid not.
The catch is, how do we measure standard deviation for a population?
Let’s go back to our example of brand preference. We can’t qualitatively assess a population’s composition on brand preference (or values or habits or lifestyle). We need to actually ask people about their brand preference, tabulate the data, compute the SD and arrive at the conclusion.
But it’s impossible to ask everyone in a 300 million population, let alone 1.3 billion. The only practical way to accomplish this goal is to conduct a survey on a sample drawn from the population.
Yet another survey!
In other words, we need an auxiliary survey to validate the original survey.
All open questions from the original survey on statistical significance, representativeness of sample, adequacy of sample size and accuracy of sample results for population will also haunt the auxiliary survey!
Therein lies the problem with standard deviation.
Ergo, while it can reflect a sample’s composition, standard deviation can’t be used to measure a population’s composition.
Again, we’re back to square one!
Unless somebody proves me wrong, I’m going on a limb and claiming that there is no quantitative measure to determine whether a population is homogeneous or heterogeneous. That means that we can’t scientifically declare that a sample size of 2000 will yield statistically significant results for a real world population.
But that’s not going to stop the zillions of opinion polls that come out every day that draw inferences about hundreds of millions of people from a sample size of 2000. I referenced many of them in Demystifying The Ubiquitous Sample Size Of 2000. Here are some more I came across after I published that post:
Digital Transformation has increased IT Complexity
Survey of 1,892 IT managers:
82% say #DigitalTransformation has increased their IT #complexity. At the same time, 79% say their enterprise #architecture program has reduced IT complexity ?https://t.co/eHlhTUOZot @ZDNet @leanix_net by @joemckendrick #CIOs
— Anja Hoffmann (@AnjaHoffmann) September 21, 2020
Moon landings were faked
Were the Moon landings faked?
Many people think so. To find out more, we collected mentions on the topic and surveyed 2000 people.
Here's what we found out. #Apollo50 https://t.co/5RPhLZsqlF
— Brandwatch (@Brandwatch) July 19, 2019
Challenger Bank is Primary Bank for one-third of Millennial Brits
Third of millennial Brits say primary bank is a challenger https://t.co/E63p4SHZN2 #fintech v/ @cgledhill@andi_staub @Fisher85M @Xbond49 @Salz_Er @floriansemle pic.twitter.com/F5PVRTpzs3
— Nick Bilodeau (@FinMKTG) December 6, 2019
And it’s not just opinion polls.
Studies with doubtful statistical significance decide the allocation of billions of dollars in Advertising, Pharma, and other industries.
- Hundreds of billions of dollars of TV advertising in the USA is allocated on the basis of Nielsen Ratings for TV shows (or what’s called TRP in India). There are over 100 millions TV sets in the US. Ratings are computed from just 80,000 Portable People Meters.
- Vaccines for billions of people in the world are approved – basis safety and efficacy – on the basis of Phase 1, 2 and 3 trials totalling to only 50,000 test subjects.
Inquiring about statistical significance is often a fool’s errand.
When advertisers complain about the tiny sample size used for computing ratings, TV companies summarily dismiss their concerns by citing the Gallup Soup Principle (see Demystifying The Ubiquitous Sample Size Of 2000.)

A regulator approved a Covid-19 vaccine before it had completed Phase 3 trials. Maybe it felt, why wait for the result of a clinical trial that’s not going to move the needle by much anyway since it’s conducted on such a tiny fraction of the population i.e. only 5,000 people.
American Banker probably came to the same conclusion in its article entitled entitled Why Visa and Mastercard are suddenly keen on installment lending. The Buy Now Pay Later (BNPL) drivers chart in this article neglects to mention the sample size.
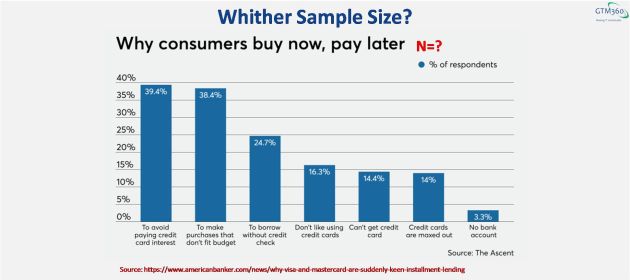
I guess the author must have decided, why mention a figure like 1000 or 2000 and invite comments from randos about statistical significance.
I’m predicting that this will become a Big Data best practice in the forseeable future.
BigData NextPractice: Don’t mention Sample Size of survey. If somebody raises tough questions about Statistical Significance, Representativeness of Sample & Homogeneity of Population, diss them as troll, hater, negative thinker.
It seems like the notion of statistical significance is dying a slow death. And, for that, I blame data science. The field tied statistical significance to sample representativeness and population composition but conveniently failed to provide a rigorous way to compute these two parameters. By taking that evasive approach, data science has kicked the statistical significance can down the road.
Practitioners across marketing, pharma and other fields may be playing footloose with sample size, test protocols, and other statistical concepts but, IMO, they’re merely leveraging the “academic gap” left by data scientists.